Hawle´s credo: Overtaking instead of catching up - an interview with the management
In November 2020, in Wiehl at the headquarters of Hawle Kunststoff GmbH.
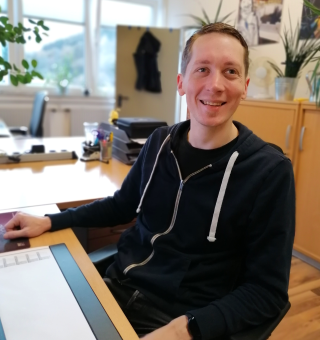
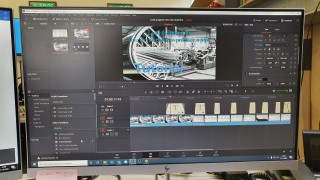
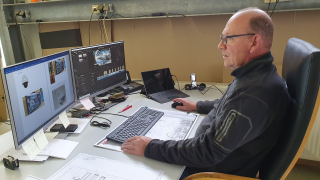
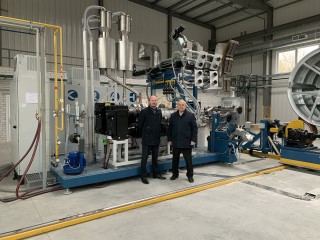
Alexander Krah visits the oldest and at the same time the newest customer in Germany, Hawle Kunststoff GmbH, formerly Bauku GmbH. This summer, the Krah Group delivered the latest production plant of the type KR800-MAX and successfully put it into operation under Corona conditions - with full physical effort. During the company visit, there was a spontaneous opportunity to motivate the two managing directors for an interview.
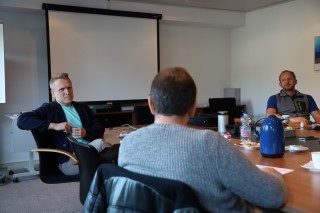
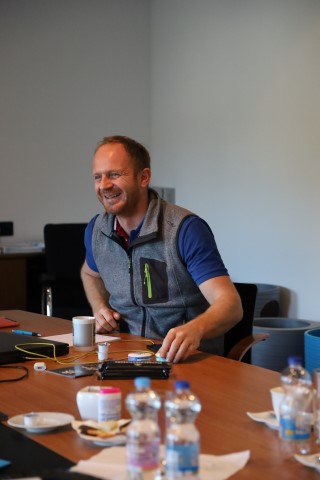
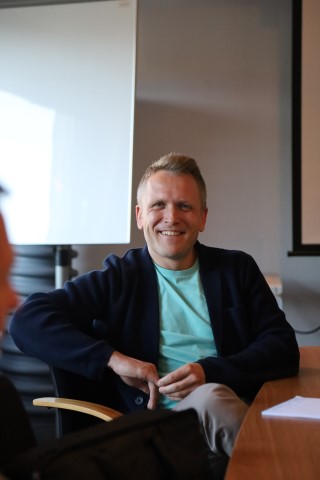
F.l.: Gerd Bonimeier, Alexander Krah and Rupert Wagner
Hello, Mr Bonimeier (B) and Mr Wagner (W). Thank you for taking the time to have a chat with us. How are you doing today on this beautiful day in the Rhineland - as a true Bavarian?
W: Every time we drive up here we ask ourselves why we are even driving up here (both laugh). At the very beginning, when we were here for the first time, we said that nobody wants to hang dead over the fence here (German idiom for “There’s not much going on there”) - that‘s what they say in Bavaria. But now we really like coming up here – over time we have learned to like the area.
People coming from the region of the Rhine are known to have a cheerful nature, do you notice it here as a Bavarian or is it simply ignored?
B: Well, basically yes, but you have to admit that in the beginning there was the problem that people here didn‘t really understand what we Bavarians are like – they didn’t really get our way of humour.
And what about the beer, do you like it compared to Bavarian Oktoberfest beer?
W: It is a bit thin, but it tastes good.
B: Well, let‘s put it this way: The glass size is definitely a big difference: In Bavaria you can only get such small glasses in the pharmacy (laughs).
What exactly do you two do at Hawle?
B: Roughly speaking, we are both managing directors of Hawle Kunststoff GmbH, but we have to dig a bit deeper in this respect. We started the whole subject a few years ago within the sister company “Hawle Armaturen GmbH”, because historically there is a company - that was active in this field, but only processed the pipe - and Hawle now attaches great importance to its own, deep value creation and would like to manufacture the products itself, and so the decision was made that we said - OK, we are now making our own profile pipe. And with Bauku GmbH, we then took this step. As we both were the only ones who dealt with this topic at that time, it was obvious that we would take care of it and so one thing led to another. Additionally, of course, we wanted to transfer this attitude of the Hawle brand, this „spirit“, to here, and so we were of the opinion that this could only be done if we sent someone to take care of it and not just lay hands on it and wait.
What does Hawle Armaturen GmbH actually do?
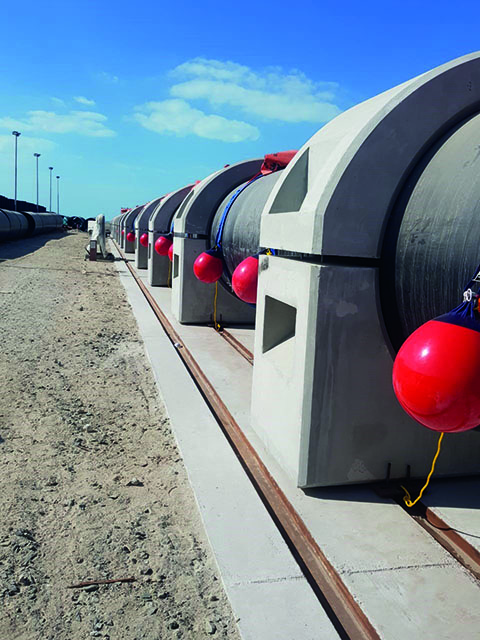
W: Hawle Armaturen actually is a manufacturer of heavy-duty fittings, i.e. hydrants, gate valves and control valves. More than 90% are produced for water supply, which means that everything Hawle produces is buried. You can actually only see it when a hydrant is in a field somewhere. Otherwise we are invisible and everyone assumes that when the tap is opened, water of sufficient quality and quantity will come. Hawle always hangs somewhere in between, not only with the fittings, but also with the fittings shaft or the pipe.
In 2015 you (Hawle) took over the insolvent Bauku GmbH winding pipe manufacturer. Why would a well-known German fittings manufacturer take over a company that deals with large pipe systems, of all companies?
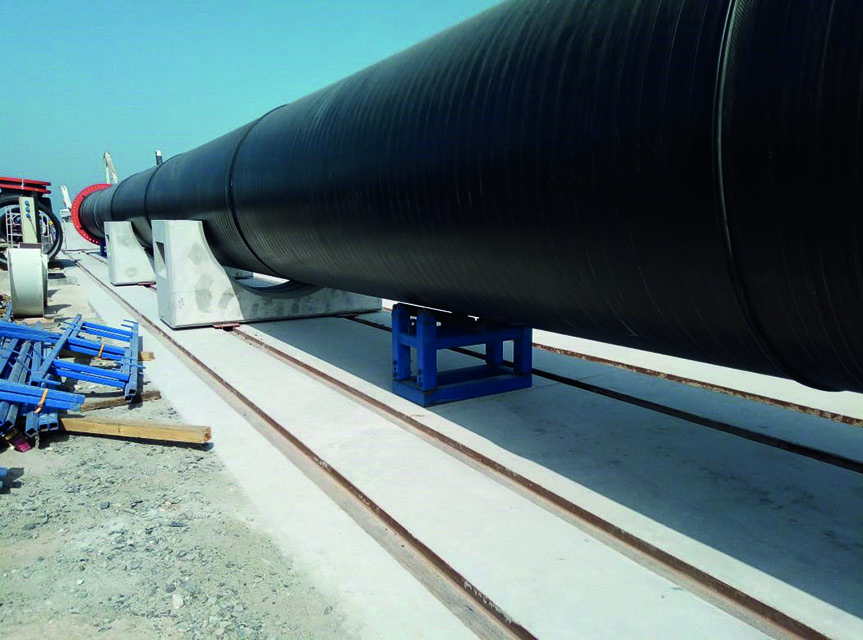
B: Well, figuratively speaking and in simple terms, we see the pipe as packaging, and we can now see very clearly where our fittings are installed. Because now we don‘t just deliver it via dealers, but we more or less manufacture the entire system ourselves and the customer installs the complete unit. This also makes it more visible to us where the products are actually going - where are we strong, where are we weak, where can we take even stronger action?
W: This „shell“ used to be made mainly of concrete, GRP, Frank pipes or additionally purchased Krah pipes, and we wanted to have an influence there, and we have influenced the market in a way that this valve well market made of polyethylene is becoming more and more attractive. Now we are also involving many small apparatus manufacturers, who in turn buy our pipe - so now we build the „shell“ ourselves.
B: It is also important to us that the ideas and the implementation often come from the customer - this is not always something we think up, the development and progress in the manhole itself is actually the customer´s requirement that makes us creative. And of course, the material also brings with it a number of advantages.
So our pipe production plant is now a machine that produces packaging material (Krah laughs). The Bauku GmbH was an old company and the name Bauku was quite well-known on the market. Why didn‘t you keep the name, but started again with Hawle plastic - isn‘t that unusual?
B: This is actually due to the fact that we did not know that Bauku GmbH existed until the 2014 fair. Until then, we had only perceived the company Frank GmbH and Henze GmbH as a manufacturer of sectional tubes. With the brand or the name Hawle, we have a very good stand on the market and therefore naturally want to sell under this/our brand name.
We wanted to start with Bauku GmbH‘s products and, if necessary, to expand into new areas - such as fire water tanks. Until then this was not a field of business for the Hawle company and we took it on board with Bauku GmbH - which opened our eyes - and fire water tanks are of course now a big issue for us.
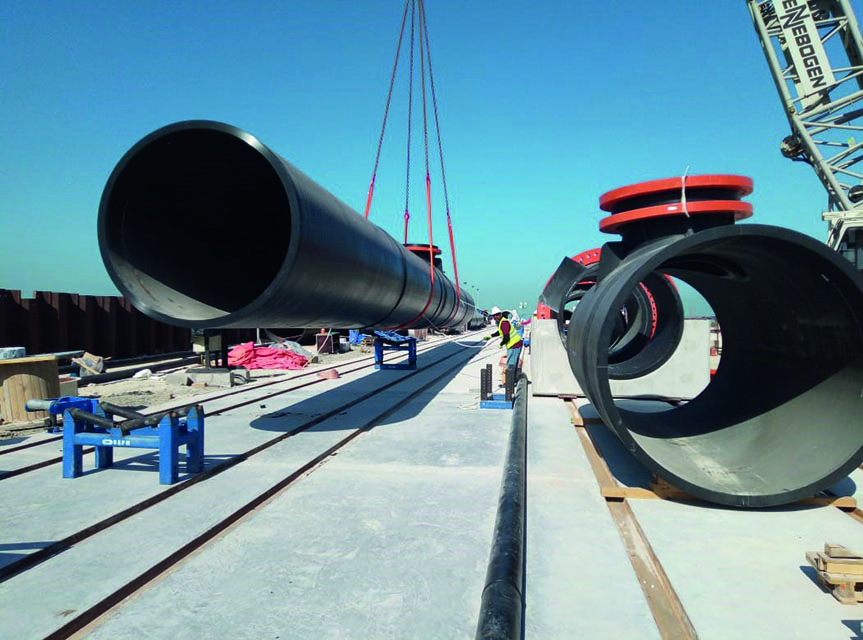
We/I as Krah (on the family and on the company side) were for years closely connected with Bauku GmbH and the founding family - until one day a dispute arose between us - but that is another story. We are therefore even more pleased to have once again delivered and installed a machine to Wiehl-Drabenderhöhe - this means that Hawle-Kunststoff GmbH is also at the cutting edge of production technology for large wound pipes. How is the production going?
W: We had the constellation that the old managing director of Bauku GmbH operated a mechanical engineering company (to produce winding machines), also with the participation of Hawle Deutschland Beteiligungs GmbH. In this respect it was of course a huge step for us not to buy from our own company, but to go to the Krah company and buy there the latest state of the art. It also took us years before we were able to implement this in the company, but we are now more than satisfied with this decision and also with the technology, and they are absolutely competitive.
What were the biggest challenges in the beginning when „converting“ the „old“ company into a „new“ one?
B: The employees of Bauku GmbH had to go through quite a lot towards the end and in the beginning it was of course the case that two young guys from Bavaria were not taken seriously. More or less according to the motto, here comes the next one and let‘s see how it ends. At the same time the question arose whether we could use what we have here for ourselves. It took a long time to find out what the Bauku GmbH covers - from the technology, and how to bring it up to the high standard we had as Hawle. And taking every single one with us was a bit difficult. Rupert Wagner always has a good example: If you bring a cow into the barn the same way for 30 years, it’s unlikely that she would like to go another way. And that was a bit of a challenge to get that into people‘s heads, that you just have to look outside the box sometimes.
Did you imagine the pipe system business as it is now?
W: Well, actually everything went very quickly. The Bauku GmbH company was insolvent, then the Hawle company came into play and a few months later it was clear that the Hawle company would buy the Bauku GmbH company. That means we didn‘t have much time to think - what was actually bought, and what kind of problems are brought on board. The problems came up after the decision was made, and then had to be tackled bit by bit: The building is very old, the employees were dismissed according to a social plan, which means that the average age of the workforce at the start of production was 55 years, one of them has pain in the shoulder, the other problems with the heart, the third on has a sore knee, so it was incredibly difficult to bring this „spirit“ back into the company – like a new beginning.
In which market segments and regions do you see your target markets?
B: We sell through different locations, with our sister companies, with Etertub in Switzerland, Liot in Austria and ushere in Germany. If you draw a radius of 500 km around these companies, we already cover a lot. We already see ourselves as Central European, or have the possibilities to deliver there and we do so. We are very active in Luxembourg, and occasionally in other countries, but Germany, Austria and Italy are the main markets for us. Very clear market segments are, of course, the supply of drinking water - where Hawle comes from, where we are strongly involved - and, of course, the disposal of waste water. Gradually, we are also getting more and more involved in these projects, which involve major measures: sewer pipes, damming systems and so on.
If you could turn back time: would you do it again like this - take over Bauku GmbH?
W: We would definitely buy Bauku GmbH again. The most important capital were the employees who were already there. They were longtime employees, some of them had been with the company for 20 or 30 years, and this experience, or to create it anew, is incredibly difficult. With all the problems we had in the beginning, it has paid off in any case to take over Bauku GmbH.
Have other acquisitions been made or are there any pending in the plastics sector?
W: Last year, we added a further company in Eastern Germany in the field of pipeline construction, in Reichenbach in the Vogtland region, where we now have 14 pipeline constructors, who are again exerting a targeted influence to ensure that the Hawle fittings are installed in the pipe space and not in a third-party or competing product.
B: Of course, it also makes us incredibly flexible in the way we work. The distribution in Germany shortens distances considerably and we can cover everything with our own staff.
What does the future of Hawle-Kunststoff look like? - Where is the Hawle journey going; what are the expectations for the following „post-Corona years“?
B: What we have in mind is quite clear: we have a foundry, the fittings factory Hawle Armaturen, Hawle Kunststoff and Hawle Service, and we want to play this trump card with customers. If we are smart, we can do a deal with a project several times, and that is exactly what we want to sell to the customer – since it’s a lot worth for the customer of course. We want to attract to us those who no longer have the manpower to cover all this. And in the end, we want to look after them from start to finish. There is no one else in Germany who can cover this range from A to Z.
What do you see as the biggest challenge in the coming years?
W: That we network and link the various locations sensibly.
And how do you do that? Is digitalisation also an issue at Hawle?
W: Of course, it is also an issue at Hawle, but it is also important to have the right people in the right places.
How many more of you are there at Hawle?
W: We have plant managers and production managers at every location - and the wheels are increasingly turning. The better these intermesh, the more powerful we are. Now we want to do more and more in the area of service as well, which means offering the customer a service right up to the commissioning of the control valve that no one else in Germany can offer at the moment - and I think we are very well positioned for the future.
Is it easy to manage a business from Bavaria? How often do you travel to Wiehl?
B: Regularly. Partly weekly, but due to Corona, we currently have larger gaps and are sometimes not there for several weeks, but basically, we are always there. Depending on what‘s on the agenda, one of us is always on site.
Last question: Judging by your hands, you are both married, can you imagine moving to the Rhineland with your families?
(both laugh) W: That‘s not an issue for us! We are both very attached to our homeland. The Bavarian is basically rooted in his roots as far as associations and family are concerned.
W: I have three small children at home, so it would be incredibly difficult for me to leave home.
I thank you both very much for the nice conversation and wish you much success and joy with the new machine!
Hawle Kunststoff GmbH
Industriegelände 9
51674 Wiehl
Germany
This email address is being protected from spambots. You need JavaScript enabled to view it.
www.hawle-kunststoff.de